1. Name of Earthquake and Disaster
Soon after the occurrence of strong earthquake on March 11, 2011, JMA (Japan Meteorological Agency) named the earthquake as "The 2011 off the Pacific coast of Tohoku Earthquake".
On April 1, 2011, Japanese Government officially decided the name of the disaster caused by the earthquake and the tsunami as "The Great East Japan Earthquake".
2. The Earthquake
A catastrophic earthquake with Mw 9.0 occurred on March 11 at 14:46JST (5:46GMT) at a depth of approximately 25km, off-shore of Sanriku, the North-Eastern part of Japan. The event which has the largest magnitude ever recorded in Japan and 4th largest in the world (Figure 1), recorded a maximum seismic intensity 7 (JMA Seismic Intensity) at Kurihara City, Miyagi Prefecture as shown in Figure 2.
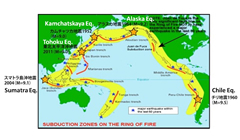
Source: http://www.geol.sci.hiroshima-u.ac.jp/~envi/link/TohokuEarthquake.html
Figure 1 World Largest Earthquakes
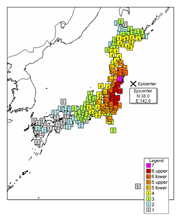
Source: http://www.jma.go.jp/jma/en/2011_Earthquake/2011_Earthquake_Intensity.pdf
Figure 2 Epicenter and JMA Seismic Intensity
This event occurred on the plate boundary between the Pacific and the Continental plates near the Japan Trench subduction zone (Figure 3) and the focal mechanism showed a reverse fault with a compression axis in a WNW-ESE direction. In this region, a large-scale inter-plate earthquake with magnitude of 7.0 to 8.5 had been predicted to occur with 99% probability within 30 years. However, the earthquake of March 11 was much bigger than that of the predicted one.
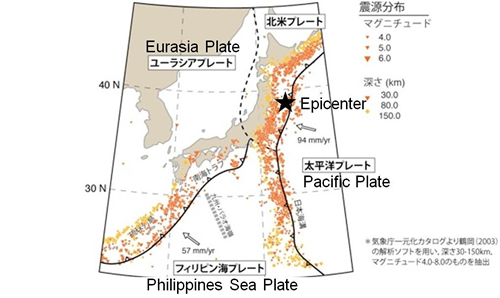
Source: http://www.geol.sci.hiroshima-u.ac.jp/~envi/link/TohokuEarthquake.html
Figure 3 Plate Boundary near Japan
However, the earthquake of March 11 was much bigger than that of the predicted one. More than 500 aftershock with larger than Mw5.0 were recorded mainly in the off-shore area of Iwate prefecture to Ibaraki prefecture with the area of 500km (NS-direction) and 200km (EW-direction) and the largest aftershock occurred at 15:15 on March 11 (JST) with Mw7.7 as shown in Figure 4 (as of April 18, 2011).
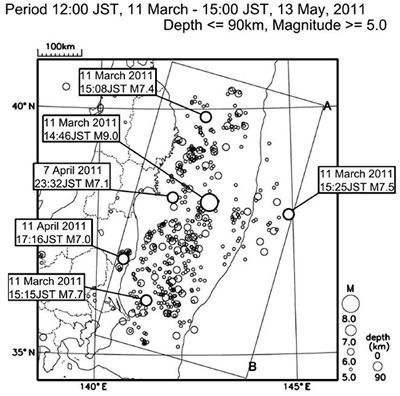
Source: JMA
Figure 4 Locations of Main Shock and Aftershock
Crustal movements especially horizontal movement to the east-southeast and land subsidence have been observed after the earthquake in wide areas from the Tohoku to Kanto Region. The maximum horizontal displacement of approximately 5.3m to the east-southeast direction was observed at the Oshika station in Miyagi prefecture (Figure 5). The maximum subsidence of approximately 1.2m was also observed at the Oshika station (Fugure 6).
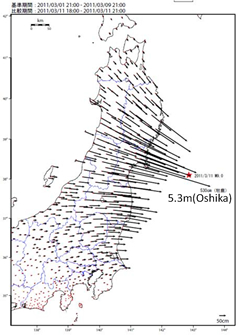
Source: GSI
Figure 5 Holizontal Displacement
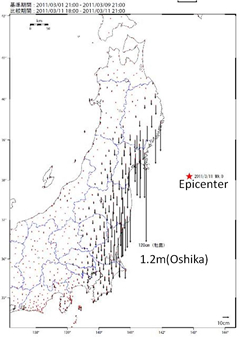
Source: GSI
Figure 6 Vertical Displacement (Subsidence)
3. The Tsunami
The earthquake generated a wide spread large scale tsunami. The tsunami reached to the coastal line of Sanriku area the nearest coast to the epicenter in about 30 min. The tsunami also propagated across the Pacific Ocean, and arrived at Hawaii in about 8 hours, the Pacific Coast of the USA in 9 to 12 hours and Chile in 22 hours (Figure 7).
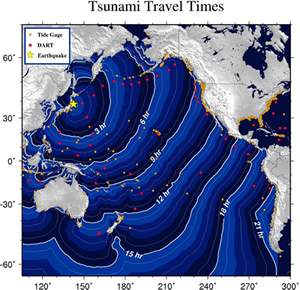
Source: NOAA
Figure 7 Tsunami Travel Times
According to the JMA report on March 12, the maximum recorded tsunami height was "more than" 7.3m at Soma Station and actual maximum height might be higher. As those stations operated by JMA were also affected very high tsunami and the tsunami height exceeded the recording range or the stations were damaged by the wave, JMA could not observe actual tsunami height.
To understand the actual height of the tsunami, researchers of universities and governmental institutes conducted survey and the survey results have been gathered and published by the Coastal Engineering Committee of JSCE (Figure 8).
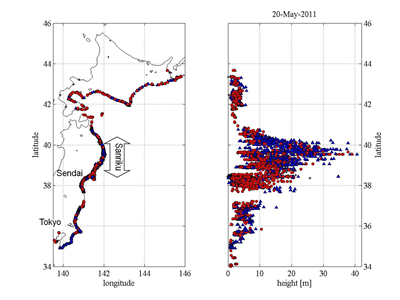
Note: not corrected for tides Source: JSCE
Figure 8 Surveyed Tsunami Heights
As shown in the Figure, the Sanriku coast was affected by the very high tsunami with the maximum run-up height of more than 30m and more than 10m in average, while the tsunami height of the southern part of the coast was relatively low with less than 10 m.
GSI conducted the analysis of the tsunami inundation along the Pacific coast (Figure 9, Sample: results of analysis), and estimated that 561 km2 was inundated by the tsunami.
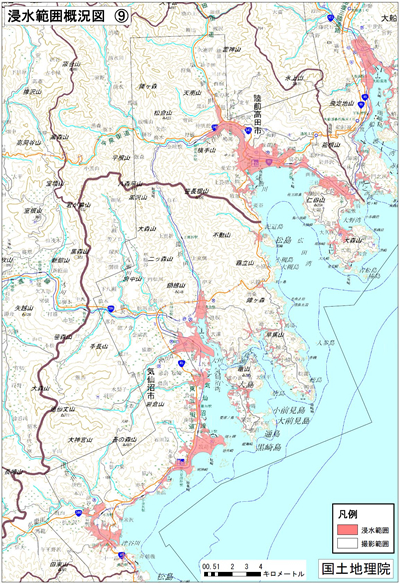
Source: GSI
Figure 9 Results of Tsunami Inundation Analysis
4. Damages
The earthquake and the tsunami caused the serious damage especially along the Pacific coast of the North-eastern Japan. The Tsunami killed tens of thousands people, and destroyed the towns, infrastructures, lifelines and other livelihoods. As of May 13, the Japanese Government confirmed 15,012 death and the number of casualties are still increasing due to delay of activities especially in the area affected by the failure of Fukusima nuclear power plant. Table 1 summarizes the human and housing damages caused by the earthquake and the tsunami by prefectures.
Table 1 Summary of Tsunami Damage
As of May 13,2011
| Human Damage | Housing Damage | ||||||
|---|---|---|---|---|---|---|---|
| Death | Missing | Injured | Destroyed | Severely Damaged | Partially Damaged | Total | |
| Aomori | 3 | 1 | 61 | 273 | 987 | 74 | 1,334 |
| Iwate | 4,392 | 3,275 | 165 | 17,100 | 2,569 | 1,259 | 20,928 |
| Miyagi | 8,941 | 5,971 | 3,411 | 56,710 | 12,237 | 13,345 | 82,292 |
| Fukushima | 1,544 | 632 | 227 | 7,246 | 5,571 | 42,202 | 55,019 |
| Ibaraki | 23 | 1 | 693 | 1,321 | 6,518 | 103,510 | 111,349 |
| Others | 38 | 2 | 722 | 947 | 3,778 | 83,271 | 87,996 |
| Total | 14,941 | 9,882 | 5,279 | 83,597 | 31,660 | 243,661 | 358,918 |
Source: Emergency Disaster Response Headquarters
As shown in the Table, about 95% of the human damage concentrated in the three prefectures of Iwate, Miyagi and Fukushima where the tsunami heights were relatively high while the housing damages distributed to prefectures along the Pacific coast.
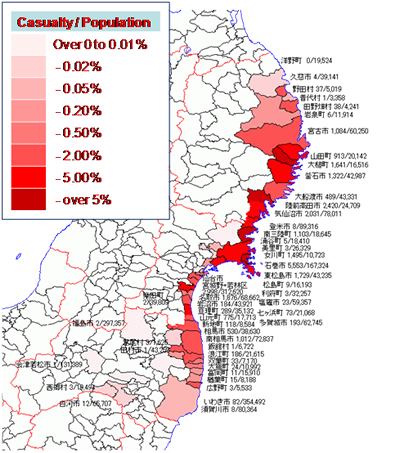
Source: Project Study Team
Figure 10 Human Damage Ratios by Local Government
Figure 10 shows the human damage ratio by the local government level. This tentative analysis for the damage ratio shows an intriguing result as relatively high value of damage ratio came at cities and towns where have been functioning as regional centers like Onagawa, Minmisanriku, Rikuzentakada, etc.
About 118,000 people are still displaced and forced to stay in temporary shelters even though the number of the displaced people is decreasing day by day. The number of the displaced people was said to be reached more than 400,000 in the peak period.
The earthquake and tsunami caused the great impact to the infrastructures such as road and bridges, railways, ports and airports and lifelines. Blackout extended approximately 8.9million houses and water outage affected about 2.2 million houses. Almost all harbors located in the pacific coast was lost its function by the tsunami.
Japanese Government estimated a total economic damage and published on March 23, and it was estimated at 16 to 25 trillion yen (USD195 to 305 billion) which is equivalent to 3.4% to 5.3% of Japan's GDP last year, and the estimates also mentioned that GDP is expected to be pushed down about 0.5% by this disaster due to the decrease in domestic production.
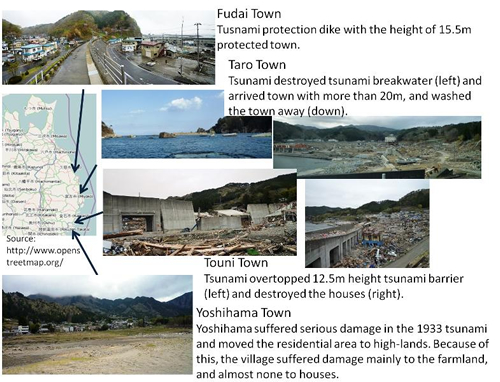
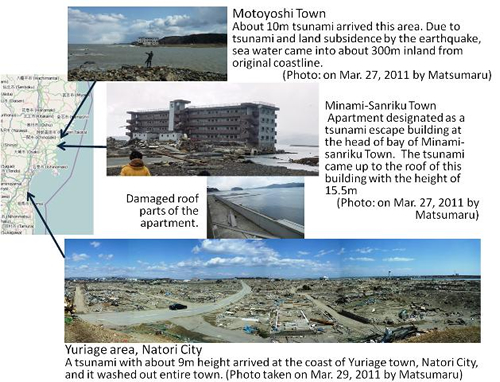
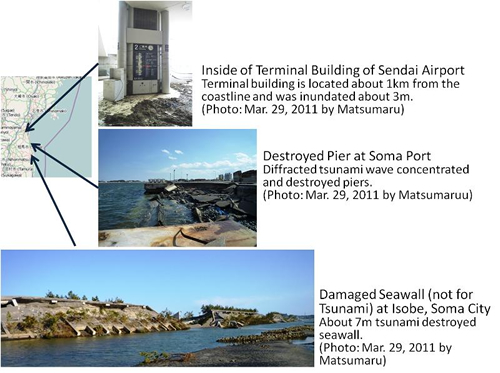
Tusnami Damage Photos
References
- https://www.jishin.go.jp/main/index-e.html
- http://www.jma.go.jp/jma/press/1104/18a/201104181715.html
- http://www.gsi.go.jp/chibankansi/chikakukansi_tohoku2.html
- http://www.jma.go.jp/jp/tsunami/observation_04_20110312193944.html#text
- http://www.coastal.jp/tsunami2011/
- http://www.gsi.go.jp/kikaku/kikaku60003.html
-
http://www.gsi.go.jp/common/000059939.pdf
(Some references are in Japanese only)
Abbreviations
- GSI: Geospatial Information Authority of Japan
- JST: Japan Standard Time
- JMA: Japan Meteorological Agency
- JSCE: Japan Society of Civil Engineers
scroll