Measuring Development Impact: Column Series No. 4—What Impacts Can Infrastructure Development Bring?
2026.03.05


Updates from JICA Ogata Research Institute on the latest events, publications and more.
RegistrationHow to Find Us


This four-part column series introduces how development impact can be measured from an academic perspective. Using examples from agriculture, education, health, and infrastructure, it highlights diverse research methods and shows how evidence can help improve policies and programs.
Huge government fundings go into transportation infrastructure development. Its benefits, however, cannot be equally distributed to everyone or everywhere, because people must access transportation infrastructure by themselves to receive its services. It is therefore important when making development plans to correctly understand how infrastructure development can affect people’s lives and actions, the heterogeneity (differences across locations and demographic groups) of such impacts, and the scale and sustainability of socioeconomic impacts.
This article focuses on urban transportation infrastructure, sharing insight from latest research findings.
You can find the other columns in this series at the links below.
Author: Yamada Eiji , Senior Research Fellow, Economic Growth and Poverty Reduction Cluster , JICA Ogata Sadako Research Institute for Peace and Development
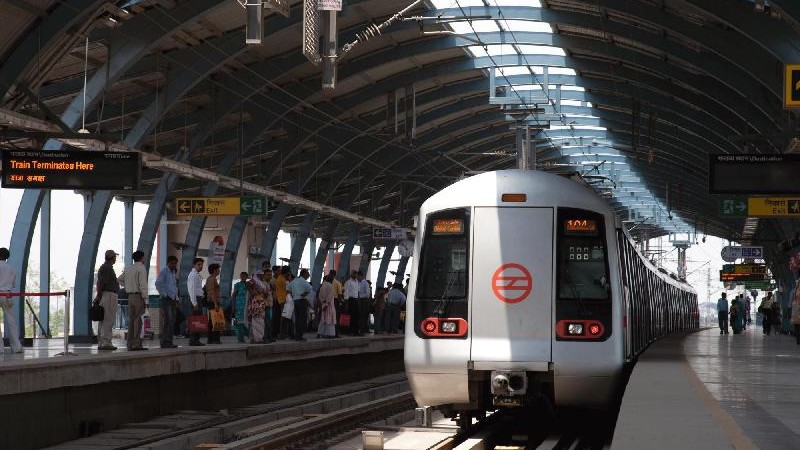
Delhi Metro (Photo: JICA / Kuno Shinichi)
Reduced traffic congestion is the primary objective of urban transportation infrastructure. This is also what many people expect to see, and recent studies have shown that urban railways alleviate traffic congestion. Traditional methods to demonstrate the alleviation of traffic congestion by a railway mainly involve measuring actual vehicle speed on major roads before and after its opening. Recently, however, we are becoming able to use route-search features of map apps like Google Maps as an alternative in such studies.1
Using route-search data on Baidu Maps, Gu et al. (2021)
showed that on roads near 45 metro lines that opened over the past 20 years or so in China, vehicle speed increased by about 4% since their openings. Dhaka Metro Rail in Bangladesh, developed through JICA’s yen loan project and opened at the end of 2022, also seems to have improved traffic flow; an assessment using route-search data on Google Maps confirmed increased vehicle speed on roads after its opening (Yamada and Jiang, 2025
).
Bus rapid transit (BRT) is also widely being introduced in developing countries. For instance, Transjakarta in Jakarta, Indonesia, is a world-leading BRT system with over 200 stations and 14 lines. Gaduh et al. (2022) 2 assessed its effects in the early days of its operation and showed how it in fact initially failed to reduce traffic congestion. The initial development prioritized cost reduction and some lanes on existing local roads were switched to BRT-reserved lanes. As a result, road capacity was reduced and traffic congestion worsened. Thus, BRT operation did not result in households near BRT routes owning less cars and congestion was not reduced.
Another main objective of urban transportation infrastructure development is to reduce air pollution, a secondary effect of traffic congestion. Goel and Gupta (2017) 3 reported that atmospheric carbon monoxide (CO) levels were temporarily reduced by 34% after the extension of Delhi Metro routes in India.
Furthermore, we are beginning to understand that these effects last over a medium to long term. Gendron-Carrier et al. (2022) 4 used satellite imagery data to compare changes over time in 121 cities around the world and showed that in cities where the air had been initially seriously polluted, the opening of metro lines reduced the air pollutant level by 4%. This effect continued for about 4 years. In addition, they showed that the opening of metro lines generates an annual mortality benefit of about 1 billion USD.
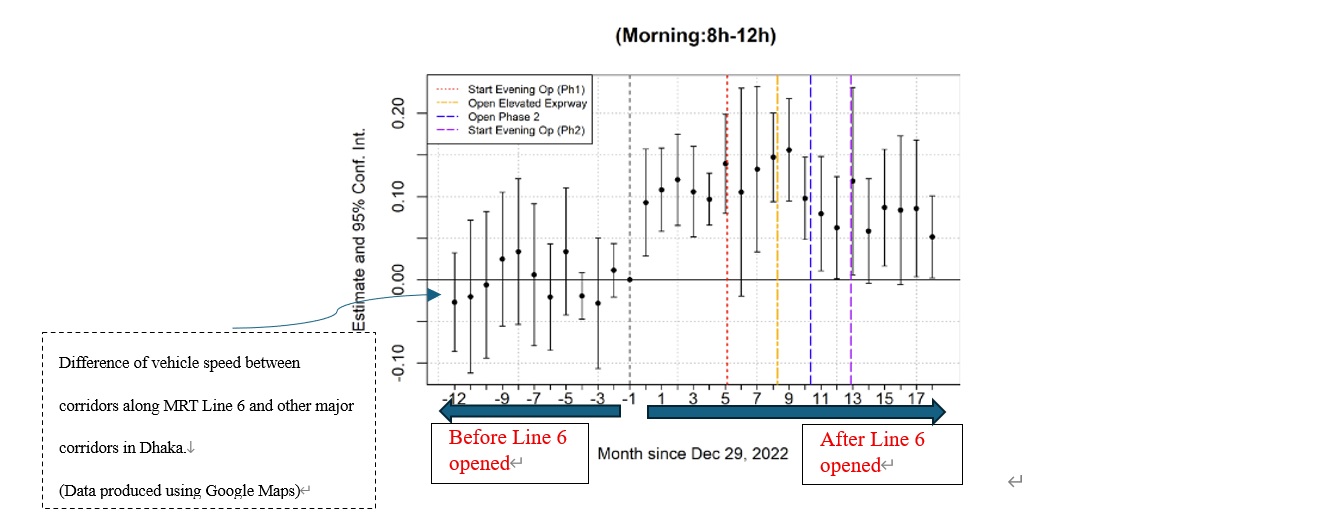
The effect of the opening of MRT Line 6 in Dhaka on vehicle speed shown by a difference-in-difference analysis (Yamada and Jiang 2025)
We are also beginning to understand that the same infrastructure can have different effects on different people, even among those living in the same area. A study on BRT and light rail transit (LRT) systems developed in Lima, Peru, by Martinez et al. 2020 5, showed that employment and income levels increased by 10% and 23%, respectively, for women who lived near BRT and LRT routes. Such effects were not seen among men.
A possible underlying driver for the increase in women’s employment is that travel time tends to be a greater stressor for women as they carry heavier domestic burdens. When BRT and LRT services reduced travel time to business districts, the wives’ workplaces became virtually closer. This is likely why employment increased among women.6 A study in Beijing (Barwick et al. 2024 )7 also showed that families think that it is worth paying as much as 18% extra (rents) to reduce the commute time of the wives than that of husbands.
Relocation of residents following infrastructure development is another key issue. In addition to the often-inevitable displacement of residents due to land acquisition, infrastructure projects lead to voluntary movement as well. A study of BRT in Dar es Salaam, Tanzania (Balboni et al. 2025
8), showed that the original households in areas along BRT routes have been replaced by households with higher incomes. It seems like BRT development increased land prices and gentrification took place, that is, those that can afford the higher land prices moved in to replace the people with lower incomes who originally lived there.9
Meanwhile, Zárate (2022) 10 found out through a case study of MRT in Mexico City that when an MRT route connected low-income areas and business districts, job opportunities increased for low-income groups and their employment shifted from informal to formal sectors. This finding shows that how infrastructure is placed may influence whether inequality grows or becomes reduced.
Not only the effects of the infrastructure itself but also the kind of policies that should be implemented in parallel with infrastructure development is a key issue. Barwick et al. (2024) used data from traffic surveys in Beijing to evaluate through simulations the combined effects of metro construction and traffic control like road traffic restrictions and congestion pricing. They showed that while metro lines alone can reduce traffic congestion, the most efficient solution is to combine metro-network expansion and congestion pricing, a system that charges fees to vehicles according to their travel distance. In this way, the overall social surplus (measured by average real income) improves by 3%, according to their estimate. Furthermore, they have estimated that income from congestion taxes can cover the total construction cost of metro lines.
Multiple studies have pointed out the importance of alignment with land-use policies—which set out the rules for urban development—to maximize the economic effects of urban transportation infrastructure. In essence, what is needed is the deregulation of land use, more specifically, the relaxation of height restrictions. Its impact is significant. In a study of TransMilenio, the BRT of Bogota, Colombia, Tsivanidis (2023) 11 concluded that social surplus would have increased by an additional 40% if appropriate deregulation had been in place. In another study, Chen et al. (2024) concluded that if the strict height restrictions in Bengaluru, India, can be relaxed as part of transit-oriented development (TOD), the overall productivity and social surplus of the city can increase by several folds.12
This article has presented research, primarily in the field of development economics, on the effects of urban transport infrastructure. These studies have revealed a wide range of insights, including differences in impact across locations and demographic groups, as well as the persistence of these effects over time. Looking ahead, it will become increasingly important to deepen the dialogue on how the knowledge generated in development economics can be effectively incorporated into practical development practice.
[1] More specifically, automated route searches between various points in urban areas are frequently performed over an extended period on Google Maps to create a database of travel time. The effects of infrastructure implementation can be measured by performing a difference-in-difference analysis on this database. For details of how to create a database of travel time using Google Maps, see Akbar, Prottoy, Victor Couture, Gilles Duranton, and Adam Storeygard. 2023. Mobility and Congestion in Urban India. American Economic Review 113 (4): 1083–1111.
[2] Data from person-trip surveys conducted by JICA in the Study on Integrated Transport Master Plan for JABODETABEK (2000–2004) and the Project for the Study on JABODETABEK Public Transportation Policy Implementation Strategy (2011-2012) were used. The survey for the former took place prior to the opening of the BRT and the survey for the latter took place after the opening of the BRT. Therefore, data from the former and the latter were used as the baseline and endline, respectively, to conduct a difference-in-difference analysis to compare the differences between places adjacent to BRT routes and places far from BRT routes before and after the opening of the BRT.
[3] In this study, a method known as regression discontinuity design was used to estimate that pollutant levels (e.g., SOx and PM) observed daily at multiple fixed points in Delhi showed a statistically significant drop after the day that Delhi Metro started to operate.
[4] A difference-in-difference analysis was performed.
[5] A difference-in-difference analysis was performed on individual response data of the person-trip surveys that were conducted during the National Household Survey of Peru before (2007) and after (2017) BRT and LRT operation started and for the Master Plan for Lima and Callao Metropolitan Area Urban Transportation in the Republic of Peru by JICA (2005).
[6] Using population census data, it was shown that the female employment rate increased in areas near Delhi Metro routes after Delhi Metro opened. (Seki, Mai, and Eiji Yamada. 2020. Heterogeneous Effects of Urban Public Transportation on Employment by Gender: Evidence from Delhi Metro. JICA-RI Working Paper.)
[7] Data from individual responses to person-trip surveys and housing-loan surveys conducted in Beijing were mainly used to create an economic model in which the obtained data reflect a market equilibrium. This model was then used to simulate how hypothetical policies would change this equilibrium.
[8] Household panel surveys were conducted before and after BRT development to understand the baseline and endline, respectively. Follow-up surveys on households that moved out from homes near BRT routes after the baseline as well as on households that subsequently moved into these homes by the endline were conducted to analyze the household replacement that followed the BRT opening.
[9] According to a study by Akbar (2025) that looked at cities in the United States, the preferred transportation means tended to differ according to income level. High-income groups tended to use railways and low-income groups tended to use buses. The study confirmed the trend of high-income residences becoming concentrated around train stations as railway development progresses, leading to residential segregation and disparities.
[10] A difference-in-difference analysis was performed using data from population and economic censuses that were conducted before and after MRT opening.
[11] Data from person-trip surveys conducted by JICA in 1995 were mainly used.
[12] Like Barwick et al. (2024), both Tsivanidis (2023) and Chen et al. (2024) created models in which conditions observed from microdata from censuses and property transactions are replicated as market equilibria and simulated the effects of deregulation. They showed that the increase in land price following MRT opening allows for land value capture. However, real estate prices do not necessarily rise immediately after the start of MRT operation. Rents of offices within the proximity of Jakarta MRT routes showed a significant drop following the opening of the MRT, according to Shimizutani Satoshi, Suzuki Tomoyoshi, and Yamada Eiji. 2025. The Impact of Urban Transportation Investment on Property Values: Evidence from the Jakarta Mass Rapid Transit. Asian Development Review.
Disclaimer: All opinions expressed in this blog post are the author’s and do not reflect opinions of JICA or the JICA Ogata Research Institute.
Sns share!

事業事前評価表(地球規模課題対応国際科学技術協力(SATREPS)).国際協力機構 地球環境部 . 防災第一チーム. 1.案件名.国 名: フィリピン共和国.
事業事前評価表(地球規模課題対応国際科学技術協力(SATREPS)).国際協力機構 地球環境部 . 防災第一チーム. 1.案件名.国 名: フィリピン共和国.
事業事前評価表(地球規模課題対応国際科学技術協力(SATREPS)).国際協力機構 地球環境部 . 防災第一チーム. 1.案件名.国 名: フィリピン共和国.
事業事前評価表(地球規模課題対応国際科学技術協力(SATREPS)).国際協力機構 地球環境部 . 防災第一チーム. 1.案件名.国 名: フィリピン共和国.
事業事前評価表(地球規模課題対応国際科学技術協力(SATREPS)).国際協力機構 地球環境部 . 防災第一チーム. 1.案件名.国 名: フィリピン共和国.